Google Analytics 4 (GA4) offers powerful tools to help businesses understand user behavior — and one of the most valuable among them is the Funnel Exploration report. This feature allows marketers, product managers, and analysts to visualize how users move through key steps on a website or app, identify where they drop off, and optimize the conversion journey.
In this article, we’ll explore what the Funnel Exploration report is, how to set it up, and show real-world examples of how it helps boost conversions.
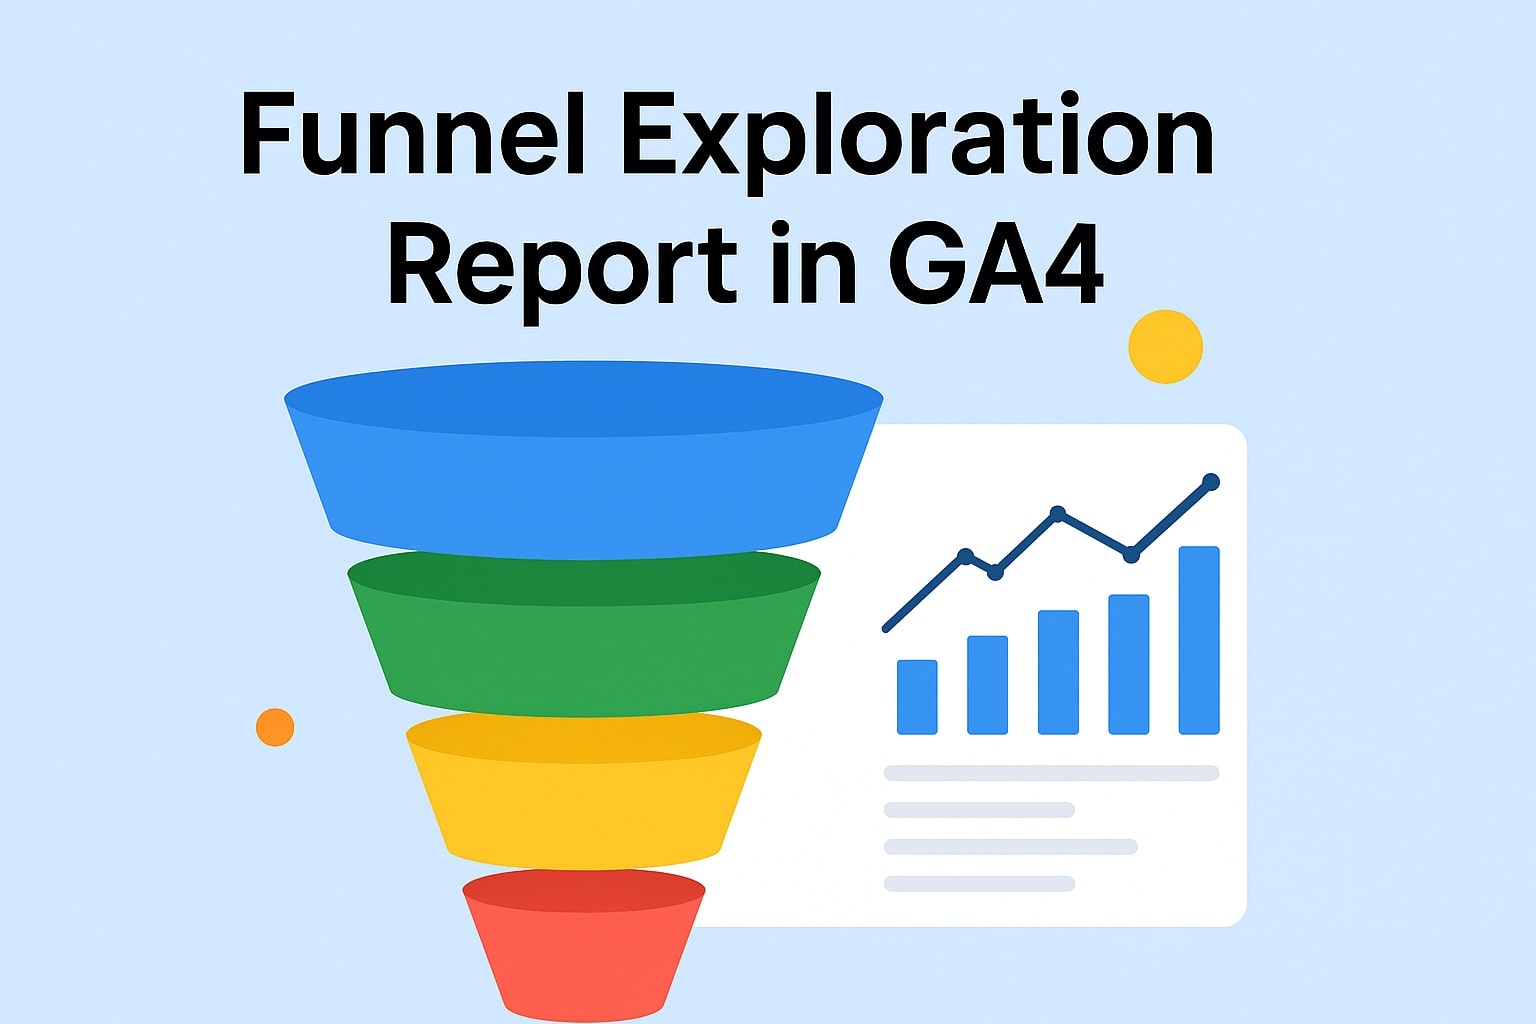
What Is Funnel Exploration in GA4?
The Funnel Exploration report in GA4 is an advanced analysis tool that helps you understand how users progress through a series of steps toward a specific goal — such as signing up, purchasing a product, or submitting a form.
It helps you visualize:
- How users enter and exit at each step of the funnel
- The conversion rate between steps
- Drop-off points that highlight friction in your user journey
Unlike Universal Analytics, GA4’s Funnel Exploration is more flexible — allowing retroactive funnel creation, segment comparison, and dynamic analysis across audiences.
Types of Funnels in GA4
GA4 provides two types of funnels:
1. Open Funnel
- Users can enter the funnel at any step.
- Useful for understanding how users engage at different stages.
- Example: Users adding items to the cart directly without viewing a product page.
2. Closed Funnel
- Users must start from the first step to be counted.
- Ideal for structured processes like checkout or registration flows.
Why Use Funnel Exploration Reports?
The Funnel Exploration report helps you:
- Visualize user behavior across each conversion step
- Identify bottlenecks where users drop off
- Measure marketing performance by comparing segments and sources
- Improve conversion rates by targeting weak steps in the funnel
In short, it’s a powerful tool for turning user data into action.
How to Create a Funnel Exploration Report in GA4
Follow these steps to set up your funnel:
Step 1: Go to Explore
In GA4, navigate to Explore → Funnel Exploration to start a new report.
Step 2: Define Steps
Add your funnel steps. For example:
- Session Start
- View Product
- Add to Cart
- Begin Checkout
- Purchase
Step 3: Choose Funnel Type
Select Open or Closed depending on your analysis goal.
Step 4: Apply Segments or Filters
You can filter by:
- Device (mobile/desktop)
- Traffic source (organic, paid, referral)
- Country or user type
Step 5: Review Insights
GA4 shows conversion rates, drop-offs, and total users for each step.
You can visualize data as a bar chart, trended graph, or table view.
Example 1: E-commerce Checkout Funnel
Let’s say you want to analyze your online store’s checkout flow.
Your funnel might look like this:
- Product View (Event:
view_item) - Add to Cart (Event:
add_to_cart) - Checkout Start (Event:
begin_checkout) - Payment Page (Event:
add_payment_info) - Purchase (Event:
purchase)
After setting this up, you notice:
- 70% of users move from Product View → Add to Cart
- 45% drop off between Checkout Start → Payment Page
This insight tells you that something in your checkout form (like a long form or limited payment options) might be discouraging users.
By simplifying the checkout or adding more payment methods, you can recover lost conversions.
Example 2: SaaS Signup Funnel
Imagine you run a SaaS product and want to measure how many users sign up for a free trial.
Here’s how your funnel might look:
- Landing Page Visit (
page_view) - Click “Start Free Trial” (
click_button) - Form Submission (
generate_lead) - Account Activation (
sign_up)
After analyzing your funnel:
- 80% of users click “Start Free Trial”
- But only 40% complete the form
This means users are interested but likely find the form too long or confusing.
By reducing the number of required fields or adding autofill options, you can increase form completion rates and drive more activations.
Tips for Better Funnel Insights
✅ Use Segments — Compare new vs returning users or device types.
✅ Add Time to Convert — See how long users take between steps.
✅ Apply Breakdown Dimensions — Like country or traffic channel.
✅ Use Path Exploration Together — To analyze what users do before or after dropping off.
✅ Set Conversions — Turn completed funnel steps into GA4 conversion events.
Funnel Exploration vs. Path Exploration
While both reports help understand user behavior:
- Funnel Exploration = Step-by-step progress toward a goal.
- Path Exploration = Visual map of how users navigate your site.
Use both together to uncover why users drop off and how they move afterward.
Final Thoughts
The Funnel Exploration report in GA4 is one of the most insightful tools for understanding and optimizing user journeys.
By visualizing how users move through your site, you can detect weak spots, refine your strategy, and boost your conversion rate effectively.
Whether you’re analyzing an e-commerce checkout or a SaaS signup flow, GA4’s Funnel Exploration provides the clarity you need to make data-driven improvements.
Vrushang Patel is an experienced SEO Analyst and Freelance SEO Specialist with over three years of expertise in boosting online visibility, rankings, and organic growth. Skilled in On-Page, Off-Page, Technical, and Local SEO, he focuses on creating sustainable strategies that deliver real results. When he’s not optimizing websites, Vrushang shares practical SEO insights to help businesses stay ahead in the digital world.